



Before01
Company profile
- 40% of sales in Europe
- No in-plant measuring
- Scope 3 unprovable
GX
Circular Operations for Traceable Outcomes
An end-to-end (E2E) integrated management solution for carbon regulation compliance
OVERVIEW
What PEF, CBAM, the GHG Protocol and DPP ask for is answered from a single carbon data system.
Environmental regulations requiring companies to report carbon emissions keep tightening, while data collection differs from site to site and is left unrefined, making data reliability hard to guarantee.
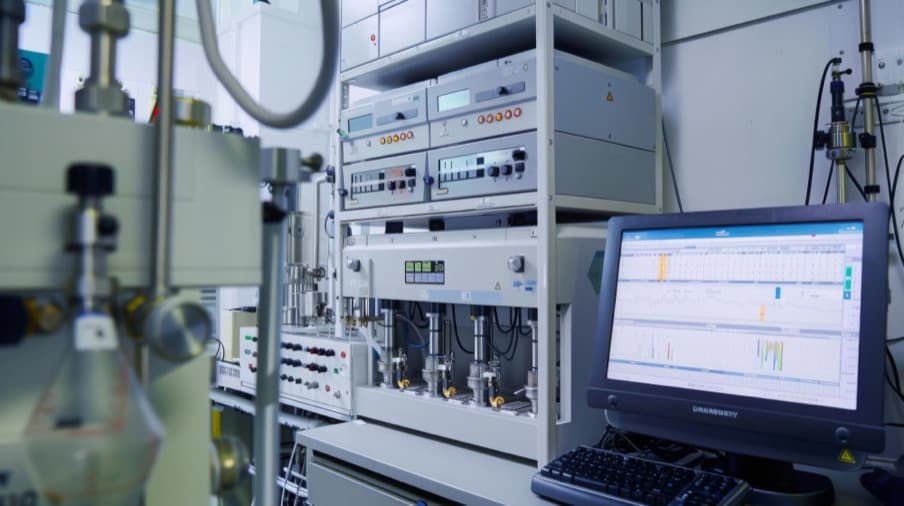
Data standards differ between the various pieces of equipment on the shop floor and external systems, which limits the ability to manage carbon emission data in one place

Many companies do not know where to start with carbon emission management, and securing dedicated in-house specialists also takes considerable cost and time.
SOLUTION LINEUP
From PEF life-cycle assessment through CBAM reporting and the GHG Protocol to DPP, on one system.
Regulation Coverage
01 / 04
01
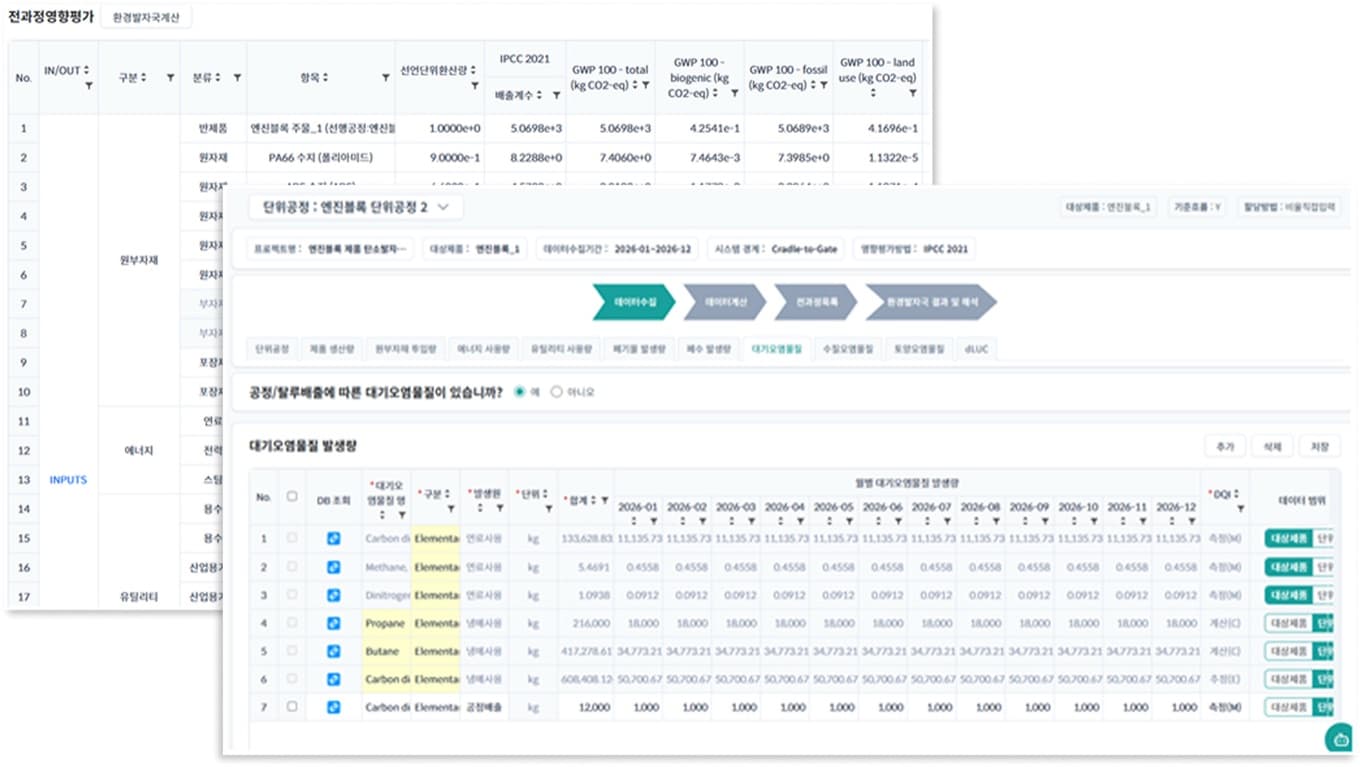
A scheme the EU introduced to assess the environmental impact of a product objectively. It quantifies 16 environmental impact categories, such as climate change and resource depletion, across the product's entire life cycle (LCA) — raw material acquisition, production, distribution, use and disposal. COTO performs LCA based on the ISO 14040/14044 international standards and, by linking to the trusted Ecoinvent database, analyzes the environmental impact per functional unit of each product in detail.
Management Scope
PEF
The EU's standardized method for quantifying the environmental impact a product causes across its life cycle (LCA).
SYSTEM ARCHITECTURE
From the data that goes in to the results on the floor.
01 / INPUT
CONNECTED OPERATIONS
EcoLine COTO
03 / OUTPUT
01 / INPUT
CONNECTED OPERATIONS
EcoLine COTO
CONNECTED OPERATIONS
EcoLine COTO
03 / OUTPUT

Steel and metal manufacturing

Automotive and batteries

Advanced industries

Defense and aerospace

Chemical industry
Construction industry
Steel and metal manufacturing
Automotive and batteries
Advanced industries
Defense and aerospace
Chemical industry
Construction industry
FUNCTION MAP
How the functions each regulation needs are grouped together.
01 · Utility & Facility
Utility and facility management
Combined power and steam emission factors, plus boilers, abatement plant and wastewater treatment as emission sources.
Sub-functions
Functions 5 · Groups 1
Set up5
SUB-FUNCTION INFOGRAPHIC
Utility and facility management · Combined electricity factor
Combined electricity factor
Combined emission factors for electricity and steam turn consumption into emissions.
PROCESS
From preparation to data exchange, and what each stage leaves behind.



EFFECT
What it leaves behind — in cost, reporting time, regulatory readiness and asset value.

Cost savings
System boundary, infrastructure and the AAS conversion engine are put in place in one go, brought in-house as a lasting capability, and a new regulation is met by extending what exists rather than reinvesting.
Less time spent collecting data and writing reports
Integrated infrastructure shortens data collection, regulatory reports are issued faster, and the hours spent on manual, repetitive administration fall away.
Regulatory compliance capability
Heavy carbon tax penalties are avoided, revenue lost by being dropped from a supply chain is prevented, and penalties caused by data errors are shut out.
Maximized infrastructure asset value
AAS keeps the data as an asset, duplicated infrastructure investment is avoided, and the cost of bringing in a new system when rules tighten falls.
CASE STUDY
Product-level carbon evidence automated into the AAS standard, keeping the European supply chain intact.

Customer industry
Automotive powertrain parts manufacturing
Before01
After02
Results
Build COTO and export carbon data on an international standard

